One approximate measure of when the potential natural snow/off piste skiing begins each season here in Northern Vermont is the date when the snowpack at the Mt. Mansfield Stake reaches 24 inches. This is by no means an exact date, especially since it’s possible to get great turns on just a few inches of snow if the snow is dense and the underlying surface is grass instead of rocks. You can indeed get by with much less than 24 inches of snowpack if the snow is very dense, but not if it’s all Champlain Powder™ fluff. Based on empirical observations and reports from skiers in the area each season though, hitting the 24” mark is reasonable for most situations.
With that preface, let’s take a look at where last season sits with regard the start of the natural snow/off piste skiing around here. By most accounts, last season started off with bang. Even in the local mountain valleys, the winter snowpack started as early as November 10th. That’s very early for the valleys, and when the valleys are doing well, the mountains certainly are too.
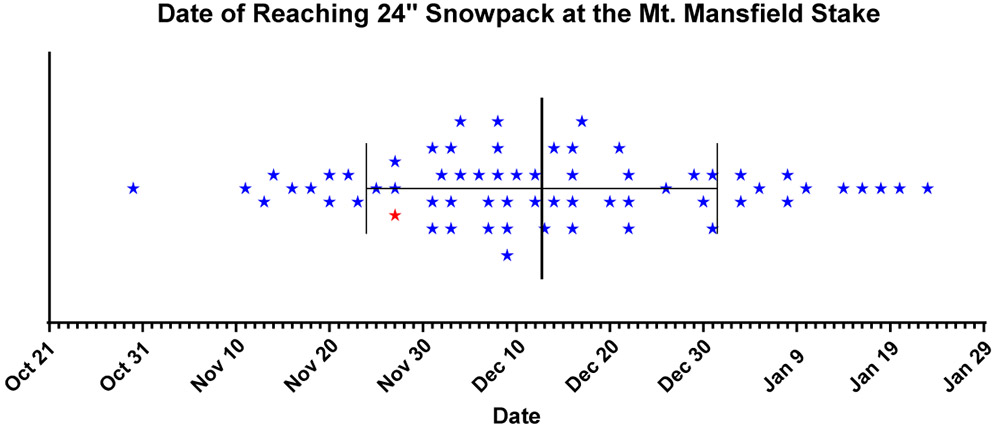
The updated plot for the 60+ seasons in the Mt. Mansfield Stake database is below, with last season represented by the red star:

Before I add a bit of context to last season’s start, here are the stats for the data set:
n: 64
Mean: Dec 12th
Median: Dec 9th
Mode: Dec 16th
S.D.: 18.8 days
Entry of this year’s data point had no effect on the mean, mode, or S.D. (within a tenth of a day), but it did drop the median by one day from Dec 10th to Dec 9th.
The plot would suggest a reasonably good start, but nothing outrageous: last year’s 24” date was Nov 27th, which is only 0.78 S.D. ahead of the mean, so well within 1 S.D. That puts it in roughly the top 22% of seasons, so about 1 in 5 seasons will have a similar or earlier 24” date.
While the 24” date is a nice snapshot for the start of the natural/off piste season, there are of course a number of other factors to take into account that made last November more impressive than that number alone:
1) Near miss: If you look at the raw November stake depth data (posted below), you can see that the snow depth at the stake reached 23” on Nov 21st. That’s as close of a miss as you can get to hitting 24”, so even as of the 21st of the month, the snowpack had essentially hit that two-foot level. Getting to that level by the 21st brings a season past 1 S.D. and into that top ~15% of seasons. That’s not a huge bump in this regard, but having nearly an extra week of borderline two-foot snowpack at that part of the season could easily mean an entire additional weekend of natural snow skiing potential.
2) No going back: This is a much bigger feather in last season’s cap. Even from about mid-month, the snowpack never really took a major hit, and once it did hit that 24” mark on Nov 27th, there was really no going back. It sailed past 24” and just kept climbing as you can see in the numbers at the end of the month. I haven’t added the December numbers below, but even with the lackluster December we had, the snowpack never dropped below ~40”. That can’t be said for all of the seasons on the left side of the plot (certainly not Mr. October out there in front, which was the 2006-2007 season – he was back to 0” at the stake by mid-November).
3) Snow-depth days: I haven’t calculated this for any November with the stake data, but it will obviously be a good integrative measure of how much snow was on the ground for the start of the season. I’m sure last November would have a solid ranking if I put those data together.
So, if we look into that left side of the plot, do we have any other recent seasons in there that we can use for comparison to last season?
Actually, that lone star (Nov 25th) just to the left of the red star for last season is for 2007-2008. We know that was a solid season around here. The snowpack began building in the first week of November, and there was really no going back there either. Unlike this past season, that solid November was followed up by a stellar December (almost 70” of snow here at the house) and the Mansfield snowpack was hitting five feet by the holidays. With a solid December, last season certainly would have given 2007-2008 a run, but instead it was languishing at around 40” at the stake during the holiday period.
With regard to some of the other stars up at that end of the plot:
The two compatriots of last season on the plot, those other two stars on Nov 27th, are 1997-1998 and 1977-1978. 1997-1998 looks pretty solid with a snowpack start in the first week of November, and snowpack at about that five-foot mark by the holiday period. There’s also a nice-looking bonus stretch of snow at the end of October, with snow at the stake for almost the last third of the month, and the depth peaking at 16”. Checking my archives, I actually went for some lift-served skiing at Sugarbush on Oct 28th, so that speaks to that period snow being a bit of something special. 1977-1978 was before my time around here, but it looks a bit tamer. There was nothing in October, then snowpack began to build around mid-November and was getting around the four-foot mark by the holidays.
The two stars right at Nov 20th are interestingly, back-to-back seasons of 1967-1968 and 1968-1969. Both had a little October snow, and then a snowpack start in the first week of November. Both had pretty steady climbs right through November and December, with 1967-1968 getting to around 40” for the holiday period, and 1968-1969 hitting a very robust 6+ feet of snowpack for the holidays. I guess that shouldn’t be too surprising, as that was just the start of a season that would become legend.
The star at Nov 18th is 1965-1966, and the progression looks sort of like 1967-1968. That’s quite a 4-year stretch of good early seasons from ’65-’66 to ’68-’69 with those three solid starts.
The star at Nov 16th is 1980-1981. That season is interesting in that the snowpack started building on Oct 20th and sailed right into November without ever going back to zero. Snowpack was 4+ feet for the holidays, but the rest of the season looks modest (relatively speaking) with the snowpack depth never getting above 6 feet.
The star on Nov 14th is for something more recent: 2003-2004. I was out in Montana for that one, but snowpack started building in the second week of November, it was 4+ feet at the holidays, and hit the 100” mark in March.
The star on Nov 13th is for 1976-1977. That looks like an impressive start, with snowpack taking hold in the second half of October, climbing right through November, and hitting roughly the 4-foot mark for the holidays. The stake didn’t quite top out at 100” that season, but it did pretty well topping out at 94”.
The final early star I haven’t mentioned yet is the one on Nov 11th, that’s for the 1990-1991 season. It seems like the only other boom and bust start to go with Mr. October (2006-2007). There was a little inkling of snow at the end of October and start of November, but snowpack started building at the end of the first week of the month and topped out at a very impressive 45” on Nov 14th! It was a downhill slide after that though. The snowpack never went lower than 9” but there were only 12-18” on the ground for the holiday period, and on Dec 30th it dropped from 18” to 13”, so that must have been quite a dagger in the holiday week (I guess that depends on whether it was a nice spring skiing day or a nasty rainstorm). The rest of that season seemed pretty blasé because the snowpack never even hit 5 feet. I don’t recall much about that season, but I’m assuming there was nothing too remarkable.
The November 2018 Mt. Mansfield snow depth data are below – note that there are a few days with no depth data available:
Date Depth
11/1/2018 2
11/2/2018 1
11/3/2018 4
11/4/2018 4
11/5/2018 4
11/6/2018 3
11/7/2018 0
11/8/2018 3
11/9/2018 1
11/10/2018 7
11/11/2018 8
11/12/2018 8
11/13/2018
11/14/2018 14
11/15/2018
11/16/2018 19
11/17/2018
11/18/2018
11/19/2018 20
11/20/2018 21
11/21/2018 23
11/22/2018 23
11/23/2018 23
11/24/2018 20
11/25/2018 19
11/26/2018 19
11/27/2018 32
11/28/2018 43
11/29/2018 46
11/30/2018 44


