Looking back at the start of the 2018-2019 ski season in Vermont – Mt. Mansfield snowpack depth and historical comparative analysis.

This plot uses the 60+ year snow depth data set from the measurement stake on Mt. Mansfield in Vermont to indicate the date when the snowpack first reaches 24 inches of depth each season.

One approximate measure of when the potential natural snow/off piste skiing begins each season here in Northern Vermont is the date when the snowpack at the Mt. Mansfield Stake reaches 24 inches.  This is by no means an exact date, especially since it’s possible to get great turns on just a few inches of snow if the snow is dense and the underlying surface is grass instead of rocks.  You can indeed get by with much less than 24 inches of snowpack if the snow is very dense, but not if it’s all Champlain Powder™ fluff.  Based on empirical observations and reports from skiers in the area each season though, hitting the 24” mark is reasonable for most situations.

With that preface, let’s take a look at where last season sits with regard the start of the natural snow/off piste skiing around here.  By most accounts, last season started off with bang.  Even in the local mountain valleys, the winter snowpack started as early as November 10th.  That’s very early for the valleys, and when the valleys are doing well, the mountains certainly are too.

The updated plot for the 60+ seasons in the Mt. Mansfield Stake database is below, with last season represented by the red star:

This plot uses the 60+ year snow depth data set from the measurement stake on Mt. Mansfield in Vermont to indicate the date when the snowpack first reaches 24 inches of depth each season.
The updated plot showing the date of reaching 24-inches of snowpack at the Mt. Mansfield Stake. The point for the 2018-2019 winter season (November 27th, 2018) is indicated by the red star.

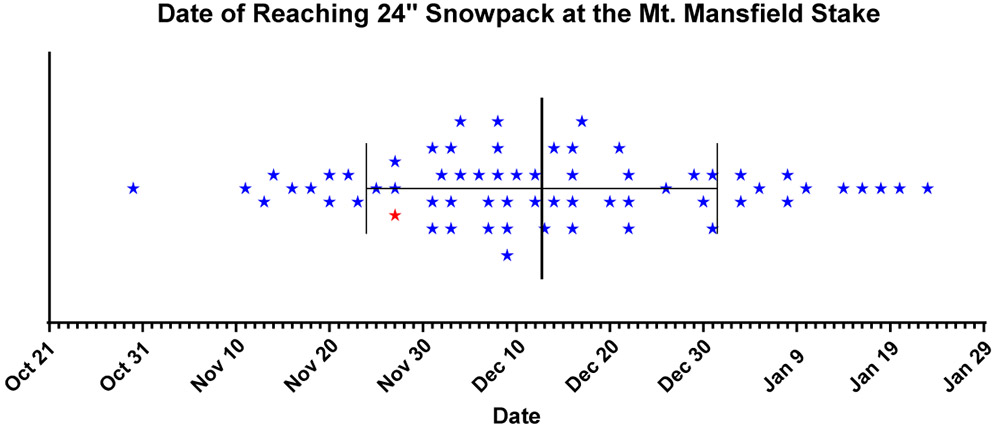
Before I add a bit of context to last season’s start, here are the stats for the data set:

n:  64
Mean:  Dec 12th
Median:  Dec 9th
Mode:  Dec 16th
S.D.:  18.8 days

Entry of this year’s data point had no effect on the mean, mode, or S.D. (within a tenth of a day), but it did drop the median by one day from Dec 10th to Dec 9th.

The plot would suggest a reasonably good start, but nothing outrageous:  last year’s 24” date was Nov 27th, which is only 0.78 S.D. ahead of the mean, so well within 1 S.D.  That puts it in roughly the top 22% of seasons, so about 1 in 5 seasons will have a similar or earlier 24” date.

While the 24” date is a nice snapshot for the start of the natural/off piste season, there are of course a number of other factors to take into account that made last November more impressive than that number alone:

1) Near miss:  If you look at the raw November stake depth data (posted below), you can see that the snow depth at the stake reached 23” on Nov 21st.  That’s as close of a miss as you can get to hitting 24”, so even as of the 21st of the month, the snowpack had essentially hit that two-foot level.  Getting to that level by the 21st brings a season past 1 S.D. and into that top ~15% of seasons.  That’s not a huge bump in this regard, but having nearly an extra week of borderline two-foot snowpack at that part of the season could easily mean an entire additional weekend of natural snow skiing potential.

2) No going back:  This is a much bigger feather in last season’s cap.  Even from about mid-month, the snowpack never really took a major hit, and once it did hit that 24” mark on Nov 27th, there was really no going back.  It sailed past 24” and just kept climbing as you can see in the numbers at the end of the month.  I haven’t added the December numbers below, but even with the lackluster December we had, the snowpack never dropped below ~40”.  That can’t be said for all of the seasons on the left side of the plot (certainly not Mr. October out there in front, which was the 2006-2007 season – he was back to 0” at the stake by mid-November).

3) Snow-depth days:  I haven’t calculated this for any November with the stake data, but it will obviously be a good integrative measure of how much snow was on the ground for the start of the season.  I’m sure last November would have a solid ranking if I put those data together.

So, if we look into that left side of the plot, do we have any other recent seasons in there that we can use for comparison to last season?

Actually, that lone star (Nov 25th) just to the left of the red star for last season is for 2007-2008.  We know that was a solid season around here.  The snowpack began building in the first week of November, and there was really no going back there either.  Unlike this past season, that solid November was followed up by a stellar December (almost 70” of snow here at the house) and the Mansfield snowpack was hitting five feet by the holidays.  With a solid December, last season certainly would have given 2007-2008 a run, but instead it was languishing at around 40” at the stake during the holiday period.

With regard to some of the other stars up at that end of the plot:

The two compatriots of last season on the plot, those other two stars on Nov 27th, are 1997-1998 and 1977-1978.  1997-1998 looks pretty solid with a snowpack start in the first week of November, and snowpack at about that five-foot mark by the holiday period.  There’s also a nice-looking bonus stretch of snow at the end of October, with snow at the stake for almost the last third of the month, and the depth peaking at 16”.  Checking my archives, I actually went for some lift-served skiing at Sugarbush on Oct 28th, so that speaks to that period snow being a bit of something special.  1977-1978 was before my time around here, but it looks a bit tamer.  There was nothing in October, then snowpack began to build around mid-November and was getting around the four-foot mark by the holidays.

The two stars right at Nov 20th are interestingly, back-to-back seasons of 1967-1968 and 1968-1969.  Both had a little October snow, and then a snowpack start in the first week of November.  Both had pretty steady climbs right through November and December, with 1967-1968 getting to around 40” for the holiday period, and 1968-1969 hitting a very robust 6+ feet of snowpack for the holidays.  I guess that shouldn’t be too surprising, as that was just the start of a season that would become legend.

The star at Nov 18th is 1965-1966, and the progression looks sort of like 1967-1968.  That’s quite a 4-year stretch of good early seasons from ’65-’66 to ’68-’69 with those three solid starts.

The star at Nov 16th is 1980-1981.  That season is interesting in that the snowpack started building on Oct 20th and sailed right into November without ever going back to zero.  Snowpack was 4+ feet for the holidays, but the rest of the season looks modest (relatively speaking) with the snowpack depth never getting above 6 feet.

The star on Nov 14th is for something more recent:  2003-2004.  I was out in Montana for that one, but snowpack started building in the second week of November, it was 4+ feet at the holidays, and hit the 100” mark in March.

The star on Nov 13th is for 1976-1977.  That looks like an impressive start, with snowpack taking hold in the second half of October, climbing right through November, and hitting roughly the 4-foot mark for the holidays.  The stake didn’t quite top out at 100” that season, but it did pretty well topping out at 94”.

The final early star I haven’t mentioned yet is the one on Nov 11th, that’s for the 1990-1991 season.  It seems like the only other boom and bust start to go with Mr. October (2006-2007).  There was a little inkling of snow at the end of October and start of November, but snowpack started building at the end of the first week of the month and topped out at a very impressive 45” on Nov 14th!  It was a downhill slide after that though.  The snowpack never went lower than 9” but there were only 12-18” on the ground for the holiday period, and on Dec 30th it dropped from 18” to 13”, so that must have been quite a dagger in the holiday week (I guess that depends on whether it was a nice spring skiing day or a nasty rainstorm).  The rest of that season seemed pretty blasé because the snowpack never even hit 5 feet.  I don’t recall much about that season, but I’m assuming there was nothing too remarkable.

The November 2018 Mt. Mansfield snow depth data are below – note that there are a few days with no depth data available:

Date                 Depth
11/1/2018        2
11/2/2018        1
11/3/2018        4
11/4/2018        4
11/5/2018        4
11/6/2018        3
11/7/2018        0
11/8/2018        3
11/9/2018        1
11/10/2018      7
11/11/2018      8
11/12/2018      8
11/13/2018     
11/14/2018      14
11/15/2018     
11/16/2018      19
11/17/2018     
11/18/2018     
11/19/2018      20
11/20/2018      21
11/21/2018      23
11/22/2018      23
11/23/2018      23
11/24/2018      20
11/25/2018      19
11/26/2018      19
11/27/2018      32
11/28/2018      43
11/29/2018      46
11/30/2018      44

2012-2013 Waterbury Winter Weather Summary

A bar graph of the month snowfall at our house in Waterbury, Vermont for the 2012-2013 winter season
Waterbury snowfall for the 2012-2013 season – broken down by month

The last snowstorm of the 2012-2013 winter season extended all the way out to Memorial Day weekend to produce some great late season skiing, but now that we’re well into summer and all the snow has melted, we can look back at how the winter went down at our location in Vermont’s Winooski Valley. The main focus in the seasonal analysis below is on snowfall, but snowpack and temperatures will be discussed as well. In this post I’ve hit on some of the highlights that came out of the data, and attached our various plots and graphs, but to get to the full data set, you can use the following link:

2012-2013 WINTER WEATHER SUMMARY

Thankfully, this past season’s snowfall (144.2″) marked a notable increase over the previous season (115.3″), but the total snowfall for 2012-2013 was still less than 90% of average, so that’s not likely to lift the season into the category of “great” winters. In addition, the amount of snow on the ground at the house last season didn’t help to improve the winter’s standing. Using the value of snow depth days as an integrative way of representing the season’s snowpack, one finds the 2012-2013 winter season producing a value of 729 inch-days, less than half the average value, and right down there in the basement with the well below average 2011-2012 season (688 inch-days). And, if the overall snowpack depth hadn’t already undermined any chances of redemption to an average level, the 2012-2013 snowpack secured the season’s ignominy by reaching the lowest value we’ve seen in January and February (3.0″), and coming within a hair’s breadth of melting out in the area around our measurement stake at a record early date in mid March:

A plot showing this past season's rather meager snowpack at our location in Waterbury (red line) relative to average (green shading)
This past season’s rather meager snowpack at our location in Waterbury (red line) relative to average (green shading)

Often, each month of the winter/snowfall season has its own unique flavor with respect to the weather, so one method I like to use to get a feel for the winter is to look at it on a month-by-month basis. Again, the focus below is on snowfall at our location, but snowpack is also considered, as well as mountain snowfall/snowpack and the associated effect on the local skiing. I’ll have a separate 2012-2013 ski season summary coming up, so I’ve kept the ski discussion minimal here in anticipation of a more thorough discussion in that report. The month’s total snowfall is listed at the start of each section below for reference:

October Month IconSnowfall: 0.1″October snowfall isn’t reliable enough down at our elevation to be factored much into the seasonal assessment, but this October was on the weak side, with just a tenth of an inch of snow, vs. the mean of roughly an inch. Regardless of this, there was still enough for the needs of companies like https://divisionkangaroof.com/areas-served/gainesville/ with the weight of the snow causing damage to some roofs. One small feather in the cap of 2012-2013 is the fact that the first accumulating snow fell on October 12th, which beats out 2010-2011’s October 15th snowfall by three days, and now represents the earliest measurable snowfall I’ve recorded here at the house since I started monitoring the weather in 2006.

November Month IconSnowfall: 6.3″November snowfall came in just a bit below average this past season, so certainly not remarkable, but notable in that it was probably about as average a November as we’ve seen. November has typically been feast or famine when it comes to snow. We actually had a total of five snowstorms in November, but a small to moderate storm of 4.4″ at the end of the month contributed the bulk of the monthly total as well as some of the first great skiing of the season in the mountains.

December Month IconSnowfall: 49.5″December held the first lengthy, redeeming snowfall period of 2012-2013. Although the first half of the month was extremely poor on snowfall (just 2.2″ of snow at the house), from the 16th of December onward, temperatures got cold and snow came in for a dramatic change; close to 50″ of snow fell on us in the second half of the month, and as a whole the month actually wound up several inches above average. Those in homes with faulty or no heating in place are likely to struggle with the crushing cold at this time of year which is why it’s so important to conduct regular maintenance on heaters so you’re not left to suffer over winter. Reaching out to the likes of these professionals could help with this – siriuspac.com/heating-repair-service/. A problem left unaddressed could snowball into substantial damage and become more costly to repair over time so it’s well worth acting on it as early as possible. We received our second (15.5″) and fourth (11.7″) largest storms of the season during that stretch, right near Christmas and just a few days apart, so needless to say, the snow was there to set quite the holiday mood in the valleys and up above on the slopes.

January Month IconSnowfall: 21.9″January continued that good, snowy weather pattern in its first week, albeit to a lesser degree than December, but unfortunately that modest first week ultimately wound up representing roughly half of the month’s snowfall. The second week featured a couple of substantial thaws with no measurable snow, and in fact we received no accumulating snow at all for the period between January 7th and 16th, a very long stretch for the mountainous areas of Northern Vermont during the winter. The third week of January offered just a few small systems, and the fourth week was arctic cold with minimal snow. The final week attempted to recoup the losses with a modest half foot storm, but it was too little too late – the month ended with just 21.9″ of snow, by far the lowest January in my records. The combination of very low snowfall and two January thaws was very deleterious to the valley snowpack – after coming down from the depths achieved in December, the snowpack depth at our location never even reached 10 inches again during the month, and got as low as 3.0 inches. That is ridiculously close to losing the winter snowpack in January, definitely the closest we’ve come based on my records since 2006.

February Month IconSnowfall: 31.4″February was again below average in snowfall, partly due to the continuation of the dry arctic pattern in the first week, and it wound up missing the mark for the lowest February in my data set by less than an inch. Although that persistent dry pattern didn’t make for a very snowy first half of the month, our third largest storm of the season (12.6″) hit in the second week. It was still a rather modest storm, but at least it did break that one foot mark for accumulation at the house. By the end of the third week of February, the snow depth at the Mt. Mansfield stake actually poked above average for the first time in about a month and a half – but it was only by a couple of inches, and it quickly went back below average as the snowpack sat there essentially stagnant for an entire month. On February 21st, the snowpack was at 65″, and roughly a month later on March 18th, it was still at 65″, without any major consolidation of more than a few inches. That’s stagnant. Our snowpack at the house languished similarly, never even getting above 10 inches of depth during that stretch – and that’s a time of year when it is usually building to its peak of the season. The carryover of the low snowpack from January also set the lowest mark (3.0″) for snowpack that we’ve ever seen in February.

March Month IconSnowfall: 30.8″ – Although certainly not approaching what we saw in the second half of December, the last part of the winter/snowfall season was the other relatively bright spot to mention. This was aided by our largest storm of the season, which delivered 21.3″ during the last third of the month. That storm was the only real standout for the month however. It did bring March above average in terms of snowfall, but only by roughly six inches, and the resulting monthly total really ranks in the middle of the pack for Marches in my records. The fact that the snowpack in the area around our snow measurement stake at the house was barely hanging on around mid month was certainly disconcerting, but the snowpack did recover somewhat with the help of a modest mid-month storm, that big storm at the end of the month, and reasonably cool temperatures.

April Month IconSnowfall: 4.2″April was even a couple inches below average for snowfall, but temperatures stayed cool enough to keep the winter season rolling along, and that’s what really helped make the period wintrier. We didn’t have any notable April snow accumulations down at our elevation, just a couple of small ones on the 2nd, and again on the 12th – 13th, but the mountains continued to get fresh snow right into mid month to keep surfaces in great form and the Mt. Mansfield snowpack robust.

May Month IconSnowfall: 0.0″ – There was no accumulating May snowfall down at the house this season, but that’s not too much of knock on the Month, because not getting snow in May is more the norm than actually getting snow. The mountains did get that beautiful Memorial Day weekend storm though, and the late season powder skiing was mighty fine. Although I can’t factor that directly into the analysis for the valley, it was quite cold in the valleys at the end of the month, and close to even snowing there.

There were a couple of other interesting notes with respect to snowfall this season:

1) Storm frequency and average storm size: Despite coming in below average for snowfall, the 2012-2013 season offered up a healthy 51 accumulating snowstorms, almost up there with the 53 storms we received in 2007-2008. Of course, to come in below average for snowfall with that many storms indicates that the average snowfall per storm was down, and indeed it was. At 2.8″/storm, 2012-2013 ranks down there with 2011-2012 (2.6″/storm), the only odd seasons out compared to the more typical seasons up near 4″/storm. For whatever reason, this season’s average came in on the low side. This is presumably due in part to many of the everyday events being on the small side, but also due to the lack of bigger storms, which is covered in point #2 below.

2) Storms with double-digit snowfall: It’s certainly an arbitrary and subtle distinction, but after looking through my data, I noticed an interesting trend with respect to each season’s largest storms for our location. In my season summaries, I always make a list of the top five storms of the season, and when the season seems to have gone well, all of those top five storms have been in the double digits for snowfall. In fact, the “best” seasons thus far have been able to surpass that five-storm threshold. For reference, here’s the top five list for this season, with the links to the detailed web pages for each storm:

Top five snowfall events
1. 21.3″ (3/19/2013-3/24/2013)
2. 15.5″ (12/26/2012-12/28/2012)
3. 12.6″ (2/8/2013-2/9/2013)
4. 11.7″ (12/21/2012-12/23/2012)
5. 7.8″ (12/29/2012-12/30/2012)

Indeed, if we look at the number of storms with double-digit snowfall by the seasons, we see an obvious trend. With the number of double-digit snowfall storms listed in parentheses after the season, one notes those “good” seasons – 2007-2008 (6), 2008-2009 (7), 2010-2011 (7) seemed to find a way to exceed five double-digit storms, whereas the poorer snowfall seasons – 2006-2007 (4), 2009-2010 (2), 2011-2012 (3), 2012-2013 (4) just didn’t. Surely the law of averages comes into play here to some degree – seasons with patterns producing lots of snow likely have a greater chance of getting a big storm in here, but that’s not a given. It’s also very suspicious that those seasons that come in sort of in that middling ground like 2006-2007 and our season of interest for this summary, 2012-2013, fall just short of making the cut. I suspect this trend may be more intact in a location like ours because of the relatively high number of storms and snowfall, and upslope snow (which was on the low side this season) as an extra protection against huge snowfall variance, but this is going to be an interesting trend to follow into the future as a gauge of snowfall seasons.

In sum, while snowfall was certainly a bit below average, and snowpack was well below average, I’d still give the season a reasonable grade. If C is average, I’d go with a C- for 2012-2013, just a bit off from making the average. Were snowpack a more significant factor in my winter preferences, one could argue for going a bit lower, but at least minimal snowpack was maintained throughout the entirety of the winter to keep everything white. Overall it could have been a lot worse, and with the amount of snowfall we did get, it’s hard to drop the season into the D range, which, based solely on snowfall and snowpack at the house, is where I’d put a season like 2011-2012.

For a complete look at all the data, charts, graphs, and tables from the winter season, head to our Waterbury, VT 2012-2013 winter weather and snowfall summary page.