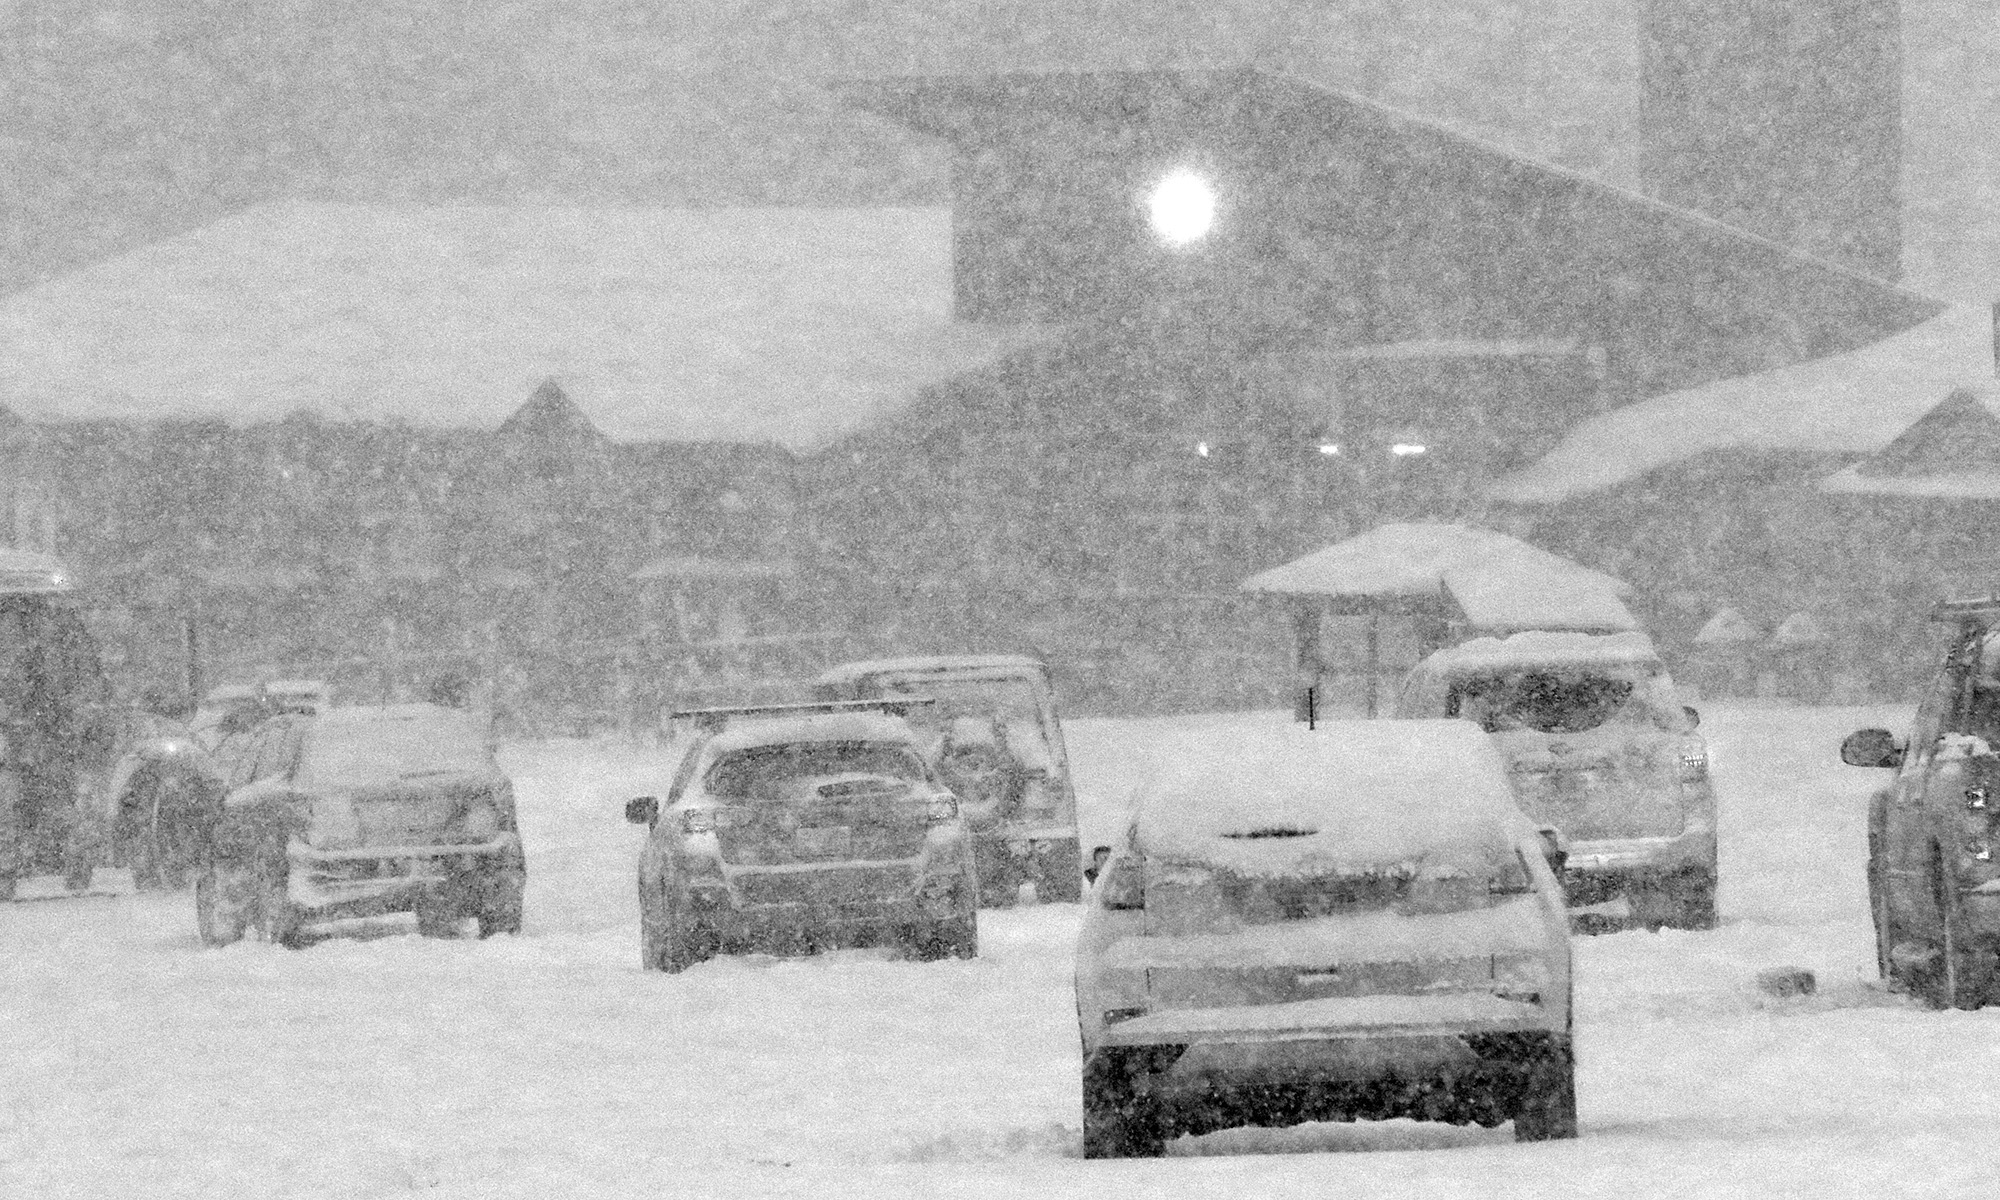
On our way toward Burlington to run some errands today, we headed up to Bolton Valley in the mid afternoon to get our season’s passes. Temperatures were in the low 40s F at the house, but started to drop pretty quickly as we ascended the Bolton Valley Access Road. The first signs of snow on the ground along the road were just above the Timberline Base in the 1,700’ elevation range, but I also noticed that slushy snow was still present on vehicles in the parking lot of the Timberline Base Lodge (1,500’) even though there was nothing left on the ground there. I suspect that the snow line was a bit lower last night, but I’m not sure quite had far down it reached. Up in the village at 2,100’ it was snowing with temperatures in the low to mid 30s F, and we found about an inch and a half of accumulated snow on the ground/elevated surfaces. It was quite a contrast descending the road and spending the afternoon in the Burlington area, where the temperatures were in the mid 40s F and it was hard to imagine that it was snowing even below 2,000’, the lapse rate actually seemed steeper than usual today. In the Champlain Valley it was often just cloudy with the feeling that precipitation had wound down, but as the afternoon wore on, spits of precipitation and bouts of light rain became more common. At times we’d have bursts of more moderate precipitation and it was nice to know that moisture was still heading to the mountains and falling as snow. Leaving Burlington later in the evening we went from 42 F in Williston to ~37-38 F at the house. There no accumulating snow to report down here as the temperature is sitting around the 37 F mark, but we’ve got light to moderate rain right now and 0.18” of liquid in the rain gauge since it was emptied this morning, so it’s probably still accumulating at elevation. A few pictures are available from our visit to the higher elevations of Vermont today.
Freeze Warnings and Frost Advisories are up throughout much of the state of Vermont tonight.
Parts of the Northeast have had bouts of sub-freezing temperatures since the end of August, but tonight looks like the first widespread occurrence of the season throughout Vermont. We’ve got a frost advisory here in Washington County, but it sounds like some of the colder areas of the state up in the Northeast Kingdom could get down into the middle 20s F, and freeze warnings are in place. It’s certainly time to cover up those gardens in the usual cold spots.
Sub-freezing temperatures are forecast for much of Vermont tonight.
Since it’s the end of August, it probably shouldn’t be that surprising that autumn-like weather is touching the Northeastern U.S., with freezing and sub-freezing temperatures hitting some of the usual cold spots. This has been one of the coldest winters we have had for a long time. For that reason, it is paramount that anyone who has a broken furnace visits https://www.burichvac.com/ in order to find a professional repair service. Equally, you might want to consider having your furnace or central heating system serviced, even if it hasn’t been showing any signs of breaking. These sorts of things should have regular maintenance and just before a very cold spell is the perfect time to check that they are working as they should be. The last thing you’d want is your heating to break as the freezing and sub-freezing temperatures hit. It is simple to find a business who offers these services; citizens of North Dakota, for example, should search for “home heating fargo” (or whatever city they call home) to find an appropriate business. This weather can be very dangerous especially for old people and those that have pre-existing health conditions should take extra care during the winter months. These days often sneak up on us though amidst the typically pleasant weather at the end of summer.
Date Snow at the stake (in.)
9/15/1959 1
9/16/1986 4
9/17/1986 2
However, assuming they have historically been using the same practice of reporting the depth of the snowpack at the end of the day (~5:00 P.M. or so) as they do now, it was likely that there was overnight September snowfall that simply didn’t make it through the entirety of many warm, September days to be reported from the stake. Therefore, I also checked the snowfall data, and found that indeed there are a fair amount of reports of September snowfall:
There are a few years with no data, but accumulating September snow does happen on Mt. Mansfield, at a rate of roughly a couple times each decade. I’m not quite sure what was going on with the 2009 number, since one doesn’t generally report snowfall to the hundredths of an inch; perhaps they are reporting a trace on that one. Not surprisingly, September snowfall is more frequent on Mt. Washington with a couple thousand feet of extra vertical – the September monthly average there is 2.2” inches, and the monthly maximum is almost 8 inches, so accumulating September snow is probably fairly common.
I also scanned the Mt. Mansfield data for August, and there was even one report of accumulation there:
Date Snowfall (in.)
8/28/1986 0.20
Since there was also mention of October, I took a look at those data as well. Because accumulating October snowfall is already fairly common even down here in the mountain valleys of the Northern Greens (out of the six season’s worth of snowfall data I have collected here, four Octobers have seen accumulating snowfall, and the average is right around an inch) I figured that getting October accumulation on Mt. Mansfield must be almost a lock. Indeed that’s the case; after checking the snowpack data from 1954 – 2012, there are only a handful of seasons without reported snowpack, and one of those seasons did at least show some snowfall:
Seasons without reported October snowpack on Mt. Mansfield
1956-1957
1963-1964 – 0.1” snowfall
1971-1972
1973-1974
1985-1986
1996-1997
2007-2008
So essentially it’s about twice a decade that there is accumulating snow on Mt. Mansfield in September, and about once a decade that there isn’t accumulating snow on Mt. Mansfield in October.
Summer is moving along here in Northern Vermont, but at J&E Productions we’ve still been thinking about the winter of 2011-2012, and we’ve finally analyzed our reams of weather data and put together our 2011-2012 Winter Weather Summary. In this post I’ve hit on some of the highlights that came out of the data, and attached our various plots and graphs, but to get to the full data set, you can use the following link:
The first item that I’ll highlight from the winter of 2011-2012 is the monthly snowfall plot for our location. As meager as the snowfall was this season at our location (just 115.3″ of snow, or 67.0% of our 2006-2011 average), the monthly distribution of snow did retain an aesthetically symmetrical look, peaking in January with February close behind:
Snowfall at our house in Waterbury was relatively low during the 2011-2012 winter season, but the monthly distribution was quite symmetrical, peaking in January.
So although 2011-2012 will go down as our least snowy in the six years that we’ve been collecting snowfall here in Waterbury, the 67.0% of our 2006-2011 calculated average is relatively decent compared to the snowfall experienced at some of the first-order New England stations like Burlington (51.4%) or Boston (21.2%). These types of seasons happen, but next season is already closing in fast, and hopefully snowfall totals will be much improved.
The next piece of information is our updated yearly snow/snowfall data table, with the 2011-2012 season now included.
When compared to the previous five seasons, the 2011-2012 winter season at our house in Waterbury was the lowest in snowfall, maximum snow depth attained, and snowpack on the ground as assessed by snow depth days. As you can imagine, it gets pretty cold at the house and so it’s always important to make sure that the heating system works. Maintaining it can be easy if you get hold of professionals in your area such as these – thecomfortdoctors.com/heating-and-cooling-services-wilkes-barre-pa/.
The table touches on some of the highlights (or in this case lowlights) from this past winter season (top data row of the table). The 2011-2012 winter season had the somewhat dubious honor of being the “worst” in our data set in three categories: total snowfall, maximum snow depth, and snow depth days (see the red entries in the top row). The snowfall and max snow depth values weren’t all that far from the runner up values, but the big standout was snow depth days, which was well below the next closest season. It’s amazing to see a number so far below the 1,000 day·inches mark, which speaks to the state of the snowpack this season. We still had continuous snowpack at the house for about three months (vs. the typical four months) but the big factor in the low snow depth days was that the snowpack just never got that deep. It sat around at a bit below the one foot mark for most of the season and just didn’t build beyond that except for a couple of periods in February/March:
At our house in Waterbury, the 2011-2012 winter season featured a fairly meager snowpack that sat around the one-foot mark for much of the season, and topped out at just one and a half feet.
With only six seasons worth of data, the low snowfall this season did deal quite a blow to the overall calculated snowfall average, dropping it by almost 10 inches from up above 172 inches per season down to 162.7 inches per season. That’s probably Mother Nature at work getting to her real averages after some banner years. Even though two of the past six seasons have been up around 200 inches of snowfall, presumably that is going to happen only so often. Nonetheless, snow of any size will cause extremely cold temperatures. As a result, make sure your heating is working properly. If not a repair kc team will be able to ensure everything is in working order. However, if you are unable to use these services you must look around for ones that are in your vicinity and can get to you in the proper amount of time. You may want to check here to see who may be available to you. Now back to the science that can help us determine the measurement of snowfall.
As for the rest of the parameters that I track in the table, they were either right around or slightly better than average this season. An interesting note is that the number of snowstorms this season (45) was right around average, so naturally with low snowfall, the amount of snowfall per storm had to take a hit. Indeed, while the average amount of snowfall per storm is typically up around 4 inches, this season it came out at just 2.6 inches, so there were clearly a lot of systems that were weak on snow. This average snowfall per storm was a huge deviation from the mean (almost 2 S.D.), so that must say something about the weather pattern during the past winter, even if I’m not exactly sure what it is at this point.
While the detailed reports of the 45 accumulating snowstorms from the past season are available with more information at the 2011-2012 winter weather summary page, they’ve also been posted here for quick access. If you know of a storm that interests you, you can head right to it. The reports are comprised of text, links, graphs, photos, etc., and much of the text is derived from my posts and dialog from the Americanwx.com New England regional forum. Thanks to the great features available on the forum, you can click on the icon associated with any quoted text in the report, and you’ll be linked right to that post its respective thread. Hopefully this will be useful for folks that are researching/reviewing winter storms. The list of linked winter storms observed at our house is listed below:
Something new that we’ve also added this season is a gallery of our snow measurement devices in action, so other folks that measure snowfall may enjoy those images:
The National Weather Service in Burlington has put out Winter Weather Advisories and Winter Storm Warnings for the upcoming winter storm in our area.
With our recent return to wintrier weather, three storms have been in the forecast, and thus far each one has been topping the previous one in terms of mountain snowfall. The first one came through Tuesday night into yesterday, and dropped 1.7” of snow here at the house and a few inches in the mountains. The second system started up yesterday, and while we picked up 0.5″ at our house in the valley, it was definitely a step up in accumulation for the northern mountains. With the addition of this second storm, two-day snow totals are just shy of the 1 foot mark at some of the Northern resorts like Jay Peak and Smuggler’s Notch, with totals tapering to the 5 to 8-inch range in the Sugarbush through Stowe stretch of the spine. I caught some turns yesterday at Bolton and the skiing was already excellent. The third storm in this triumvirate is expected to start today, and depending on how it plays out with the mountain upslope snow, another 1 to 2 feet could be added in the mountains on top of what was already received from the first two storms. Winter Storm Warnings are up for many areas, and this morning’s Storm Total Snowfall Map from the National Weather Service Office in Burlington is added below. In any event, with the moderate density snow already down from the first two systems, whatever this storm delivers, the potential is there for a great weekend on the slopes.
The Storm Total Snowfall Forecast map for the morning of February 24, 2012 for the upcoming winter storm – 1 to 2 additional feet of snow are expected in the mountains.
Snow totals from this storm were quite impressive. I’ve put together the north to south snowfall totals I’ve seen from the Vermont ski areas for this storm (list 1) and the sum of all three storms we’ve had since midweek (list 2).
As is often the case, there’s a very clear north to south gradient for snowfall, this time with the northern resorts measuring in feet, while the southern resorts are measuring in inches. This was a great enhancement to the snow depths in the northern and central resorts, and it looks like roughly 2 inches of liquid went into the snowpack on Mansfield. You know it’s a decent storm cycle period when the depth of snowpack at the stake goes from a below average 49 inches on Wednesday, to an above average 81 inches as of today.


