Summer is moving along here in Northern Vermont, but at J&E Productions we’ve still been thinking about the winter of 2011-2012, and we’ve finally analyzed our reams of weather data and put together our 2011-2012 Winter Weather Summary. In this post I’ve hit on some of the highlights that came out of the data, and attached our various plots and graphs, but to get to the full data set, you can use the following link:
2011-2012 WINTER WEATHER SUMMARY
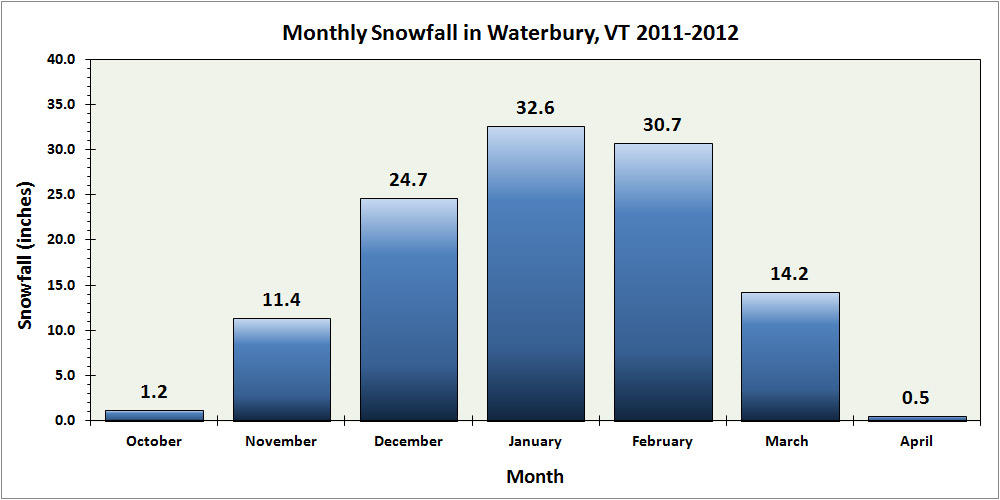
The first item that I’ll highlight from the winter of 2011-2012 is the monthly snowfall plot for our location. As meager as the snowfall was this season at our location (just 115.3″ of snow, or 67.0% of our 2006-2011 average), the monthly distribution of snow did retain an aesthetically symmetrical look, peaking in January with February close behind:

So although 2011-2012 will go down as our least snowy in the six years that we’ve been collecting snowfall here in Waterbury, the 67.0% of our 2006-2011 calculated average is relatively decent compared to the snowfall experienced at some of the first-order New England stations like Burlington (51.4%) or Boston (21.2%). These types of seasons happen, but next season is already closing in fast, and hopefully snowfall totals will be much improved.
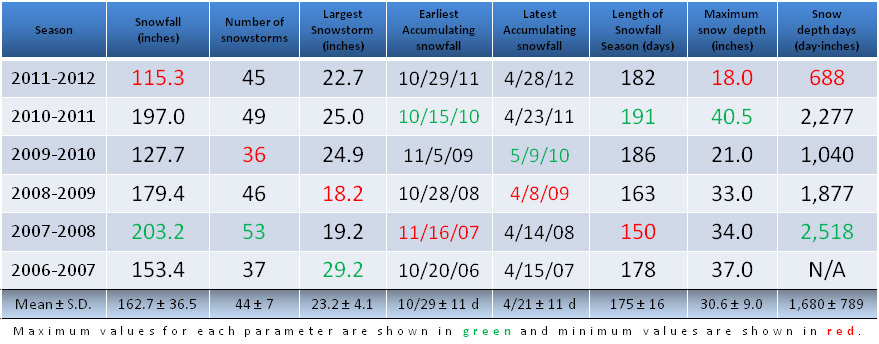
The next piece of information is our updated yearly snow/snowfall data table, with the 2011-2012 season now included.

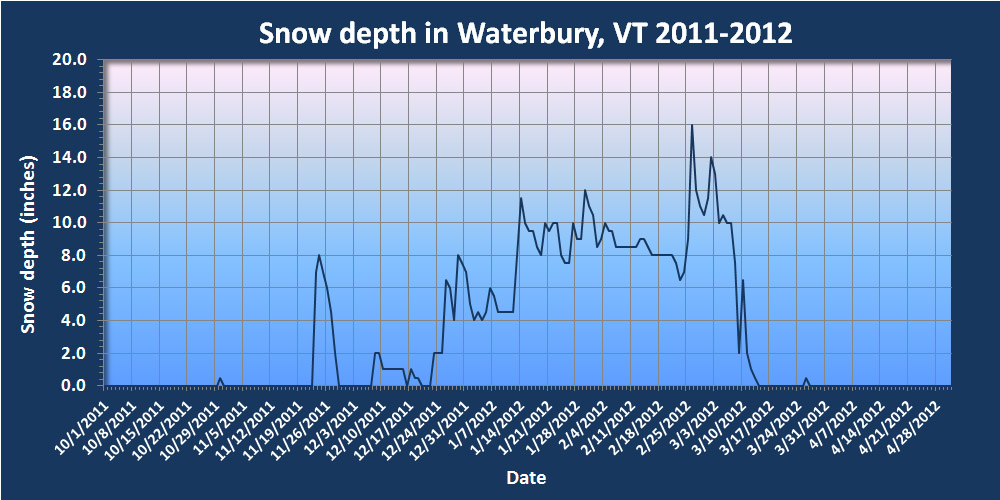
The table touches on some of the highlights (or in this case lowlights) from this past winter season (top data row of the table). The 2011-2012 winter season had the somewhat dubious honor of being the “worst” in our data set in three categories: total snowfall, maximum snow depth, and snow depth days (see the red entries in the top row). The snowfall and max snow depth values weren’t all that far from the runner up values, but the big standout was snow depth days, which was well below the next closest season. It’s amazing to see a number so far below the 1,000 day·inches mark, which speaks to the state of the snowpack this season. We still had continuous snowpack at the house for about three months (vs. the typical four months) but the big factor in the low snow depth days was that the snowpack just never got that deep. It sat around at a bit below the one foot mark for most of the season and just didn’t build beyond that except for a couple of periods in February/March:

With only six seasons worth of data, the low snowfall this season did deal quite a blow to the overall calculated snowfall average, dropping it by almost 10 inches from up above 172 inches per season down to 162.7 inches per season. That’s probably Mother Nature at work getting to her real averages after some banner years. Even though two of the past six seasons have been up around 200 inches of snowfall, presumably that is going to happen only so often. Nonetheless, snow of any size will cause extremely cold temperatures. As a result, make sure your heating is working properly. If not a repair kc team will be able to ensure everything is in working order. However, if you are unable to use these services you must look around for ones that are in your vicinity and can get to you in the proper amount of time. You may want to check here to see who may be available to you. Now back to the science that can help us determine the measurement of snowfall.
As for the rest of the parameters that I track in the table, they were either right around or slightly better than average this season. An interesting note is that the number of snowstorms this season (45) was right around average, so naturally with low snowfall, the amount of snowfall per storm had to take a hit. Indeed, while the average amount of snowfall per storm is typically up around 4 inches, this season it came out at just 2.6 inches, so there were clearly a lot of systems that were weak on snow. This average snowfall per storm was a huge deviation from the mean (almost 2 S.D.), so that must say something about the weather pattern during the past winter, even if I’m not exactly sure what it is at this point.
While the detailed reports of the 45 accumulating snowstorms from the past season are available with more information at the 2011-2012 winter weather summary page, they’ve also been posted here for quick access. If you know of a storm that interests you, you can head right to it. The reports are comprised of text, links, graphs, photos, etc., and much of the text is derived from my posts and dialog from the Americanwx.com New England regional forum. Thanks to the great features available on the forum, you can click on the icon associated with any quoted text in the report, and you’ll be linked right to that post its respective thread. Hopefully this will be useful for folks that are researching/reviewing winter storms. The list of linked winter storms observed at our house is listed below:
01. 10/29/11
02. 11/11/11
03. 11/17/11
04. 11/23/11
05. 12/02/11
06. 12/07/11
07. 12/09/11
08. 12/13/11
09. 12/17/11
10. 12/19/11
11. 12/21/11
12. 12/23/11
13. 12/25/11
14. 12/27/11
15. 12/30/11
16. 01/02/12
17. 01/05/12
18. 01/06/12
19. 01/10/12
20. 01/12/12
21. 01/17/12
22. 01/19/12
23. 01/21/12
24. 01/23/12
25. 01/26/12
26. 01/28/12
27. 01/29/12
28. 01/31/12
29. 02/03/12
30. 02/11/12
31. 02/13/12
32. 02/16/12
33. 02/21/12
34. 02/22/12
35. 02/24/12
36. 02/28/12
37. 02/29/12
38. 03/02/12
39. 03/04/12
40. 03/08/12
41. 03/09/12
42. 03/26/12
43. 03/28/12
44. 04/04/12
45. 04/26/12
Something new that we’ve also added this season is a gallery of our snow measurement devices in action, so other folks that measure snowfall may enjoy those images:
The various data charts and graphs from this season’s analysis can also be viewed in the gallery below:


It is interesting that the number of snowstorms was fairly average. Obviously, total inches per storm was much less. It was even worse outside of NoVT. Some lines at Cannon were not skiable (without significant rock damage in most cases or not at all for the most extreme lines) all season. I didn’t skin local lost area Tenney once due to lack of coverage.
Nice write up!
Yeah, that was very interesting to still have the typical number of accumulating storms here last season despite the low snowfall. There’s no question that a big part of it was all those “sandwich” storms with the mixed precipitation in the middle – the inches of snowfall that would have been there simply weren’t there, and the result was an average of just 2.6 inches of snow per storm. It really stands out amongst the other seasons for which we have data:
Season – # of storms – inches/storm
2006-2007 – 37 – 4.1”
2007-2008 – 53 – 3.8”
2008-2009 – 46 – 3.9”
2009-2010 – 36 – 3.5”
2010-2011 – 49 – 4.0”
2011-2012 – 45 – 2.6”